Difference between revisions of "MoRE Developer"
IWG-MoRE-en (talk | contribs) (→Reading and writing mode) |
IWG-MoRE-en (talk | contribs) (→Design of the MoRE Developer GUI) |
||
| Line 24: | Line 24: | ||
= Design of the MoRE Developer GUI = |
= Design of the MoRE Developer GUI = |
||
| + | |||
| + | The MoRE Developer GUI consists of the following components: |
||
| + | |||
| + | [[File:MoRE_Developer.png]] |
||
| + | |||
| + | * Overview of all object tables (left window) |
||
| + | * A data grid (middle window) in which records from a selected object table are displayed |
||
| + | * an attribute window (upper right window) and |
||
| + | * a structure window (lower right window), which both show additional information about a selected record in the data grid. |
||
| + | |||
| + | Further, MoRE features two toolbars with different functionalities (reference) which appear in the title bar of the data grid as well as in the title bar of the attribute window. |
||
| + | All mentioned components are explained in detail in the following sections. |
||
| + | |||
| + | |||
| + | == Object tables == |
||
| + | |||
| + | With the MoRE Developer GUI, data from the PostgreSQL-database can be accessed. These data are listed in object tables and summarized in the folders '''documentation''', '''modeling''', '''validation''' as well as '''translation''' and '''data management''' (only visible as administrator). Object tables can be selected by clicking on the name of the desired object table. A red arrow appears in front of the name of the selected object table and the name is highlighted with blue color. Only one object table can be selected at once. |
||
| + | |||
| + | [[File:MoRE_object tables.png]] |
||
| + | |||
| + | |||
| + | |||
| + | == Object table documentation == |
||
| + | |||
| + | In the object table documentation, the metadata of the primary data and the input data created from them is managed. |
||
| + | |||
| + | |||
| + | == Object table modeling == |
||
| + | |||
| + | The object tables modeling contain, first of all, the spatial modeling units as well as the metadata of the variables which are assigned to input data. Additionally, input data values of the variables can be recalled here. In this module all calculation approaches are defined and the created results are shown. Finally, adjustments for the visualization of data in the MoRE Visualizer can be made here. All subunits are explained in detail in the following sections. |
||
| + | |||
| + | === Spatial modeling units === |
||
Revision as of 11:27, 13 May 2019

At first, a description of how to launch the MoRE Developer is given. Then the design of the MoRE Developer user interface is described. The procedure for embedding an alternative spatial basis for modeling, different input data and modeling approaches and for generating results is explained. Furthermore, a short overview of different working tools in MoRE is given.
Contents
Launch MoRE
For launching the multi-user version of MoRE, select the respective shortcut (“MoRE_UBA_EN”) in the folder “UBA” or in the folder of a different project. Confirm the execution, if necessary.
For launching the single-user version (SQLite version), select the file “MoRE.exe” in the respective folder.
Reading and writing mode
MoRE starts automatically in reading mode. In this mode, no adjustments can be made except for the interface configuration. To add, edit or delete variables, input data or other items, it is necessary to activate the writing mode. The currently active mode is visible in the lowest bar of the GUI. The mode can be changed from reading to writing (or vice versa) by clicking on the green or yellow button, respectively.
Design of the MoRE Developer GUI
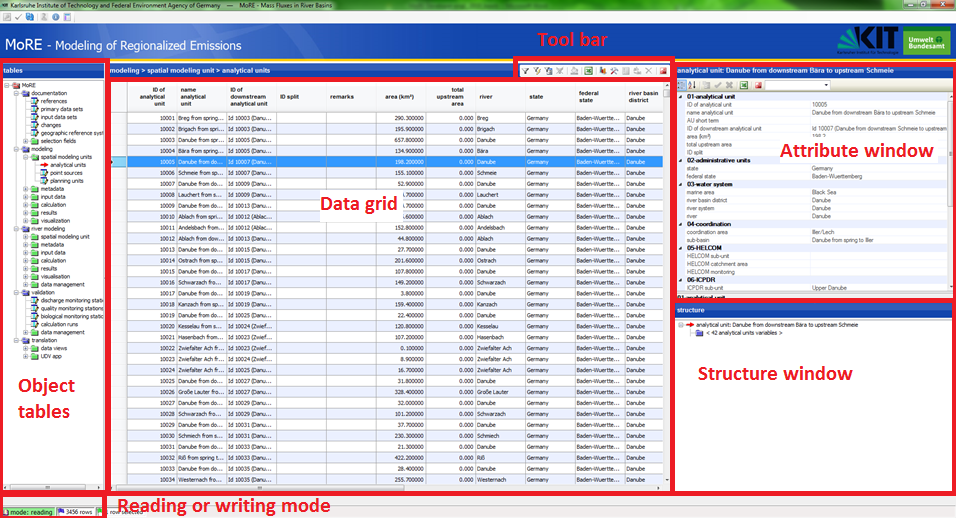
The MoRE Developer GUI consists of the following components:
- Overview of all object tables (left window)
- A data grid (middle window) in which records from a selected object table are displayed
- an attribute window (upper right window) and
- a structure window (lower right window), which both show additional information about a selected record in the data grid.
Further, MoRE features two toolbars with different functionalities (reference) which appear in the title bar of the data grid as well as in the title bar of the attribute window. All mentioned components are explained in detail in the following sections.
Object tables
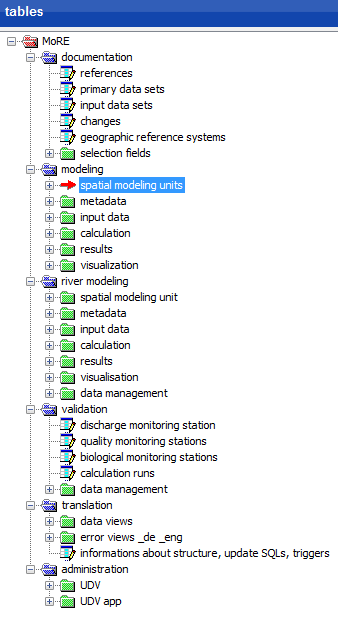
With the MoRE Developer GUI, data from the PostgreSQL-database can be accessed. These data are listed in object tables and summarized in the folders documentation, modeling, validation as well as translation and data management (only visible as administrator). Object tables can be selected by clicking on the name of the desired object table. A red arrow appears in front of the name of the selected object table and the name is highlighted with blue color. Only one object table can be selected at once.
Object table documentation
In the object table documentation, the metadata of the primary data and the input data created from them is managed.
Object table modeling
The object tables modeling contain, first of all, the spatial modeling units as well as the metadata of the variables which are assigned to input data. Additionally, input data values of the variables can be recalled here. In this module all calculation approaches are defined and the created results are shown. Finally, adjustments for the visualization of data in the MoRE Visualizer can be made here. All subunits are explained in detail in the following sections.


